
.svg)
Free Survey
About Us
Shop

You may have once looked at a rabbit and seen a duck. Or stared at a young woman and found an old crone. Or 'spotted' a Dalmation in a field of dots. These classic optical illusions expose how your mind works. Your brain is not a computer. The brain is a sensemaking machine whose evolutionary priority is survival. It searches for threats, looks for opportunities, and hunts for patterns.
You can catch a ball. A computer would have to make thousands of calculations in real-time to perform the same task. It would use machine learning to discover what balls look like in all their various forms. Image processing to pick out the moving ball from its background. The computer’s calculations would factor in mass, velocity, and gravity. Meanwhile, you just catch the ball.¹

Our ability to perform tasks, like catching a ball, without thinking is a feature of how our brains work. We don’t calculate; we guesstimate. We use gut feels, intuition, rules of thumb, and mental shortcuts. We do this continuously to save calorie burning thinking.
These cognitive biases help us navigate the world. We’re mostly unaware of them. Only when confronted with something that defeats our sense-making apparatus, like optical illusions — are these shortcuts exposed.
One senior executive, who we work with, likes to see data that “ticks and ties.”² For her, the chart has to make sense visually. If it doesn’t, she will make her confusion known. Because the chart doesn’t “tick and tie,” she will begin to question the presenter’s validity, the underlying data, or the conclusions the presenter is trying to make.
What does “tick and tie” mean? If a specific color represents a product category on slide 1, that scheme should carry through to other pages. If a piece of data is a forecast result, it should look different from an actual result.
What’s going on here? Like everyone else who looks at a chart, she applies “pre-attentive processing” to the data. This mouthful means that when anyone looks at a visual, they are making unconscious assumptions about it. They are gleaning information rapidly, based on color, form, and other visual features. This processing happens unconsciously, in fractions of a second.
These pre-attentive principles can help you; it’s useful to know the laws of Gestalt psychology.³
Gestalt is a German word meaning “understanding the whole, not merely the sum of its parts.” It’s those set of cognitive biases that help us to encode meaning from visual input. They allow us to make connections and see patterns. You will see these at work all around you, in everything from brand logos to camouflage and packaging to fashion.

There are six Gestalt principles particularly relevant to data visualization.

Figure/ground is the law behind those optical illusions. It’s key to helping us understand visual hierarchy. Typically, we want to focus on the ‘figure’ and use ‘ground’ for context — for example, a pie chart, where we want to focus on a particular segment. With it, we can fade gridlines into the background. Or use it on a line chart, with other data, grayed out but visible for context.

This law helps us group and categorize to see patterns. We assume that similar color, shape, size, or type imply some kind of meaning. Therefore we implicitly group those objects.

We assume near things are more related than distant things. This grouping together again implies a pattern, where those objects exist in a similar category.

The law of closure is powerful. In gestalt thinking, we tend to fill in the gaps, even when nothing is there. For example, it’s no problem for you to c*mp**te this sentence, even though letters are missing. Gestalt closure is useful when removing chartjunk and improving the data to ink ratio of a visual.

We like to predict the future. It’s the unthinking skill we use to catch a ball, and it’s one we apply to charts. We will look at a trend and predict its path, even though past results might not be a reliable indicator of the future.

The law of experience can bite you. We rely on experience — we’ve seen it before — to help us navigate and interpret. Icons are useful when we’ve seen them before and can interpret what they mean. Using pink as a focus color on a previous slide and carrying that over relies on the law of experience.
The law of experience is also the one that tends to damp down innovation in data visualization. Your boss would “like to see the data as a table” because he’s used to it. The law of experience derails your new slope graph or dot plot because your audience is more comfortable with a pie chart or a bar chart.
You now know people don’t think too much when looking at your charts. They are making assumptions, guessing, or otherwise distracted over the fruits of your data-labor. So how can you clean up your charts to give you the best chance of success?
We’ll assume that you understand the point you are trying to make, have an idea of what they are looking for in your data, and have chosen the right form for your chart.
Here are some “how-to” rules to help people read your charts without too much thinking.
Write a headline for that chart. This is a belt and braces⁴ approach. With a headline, even if some of your audience has trouble interpreting your chart, they can at least read the headline and understand your point.
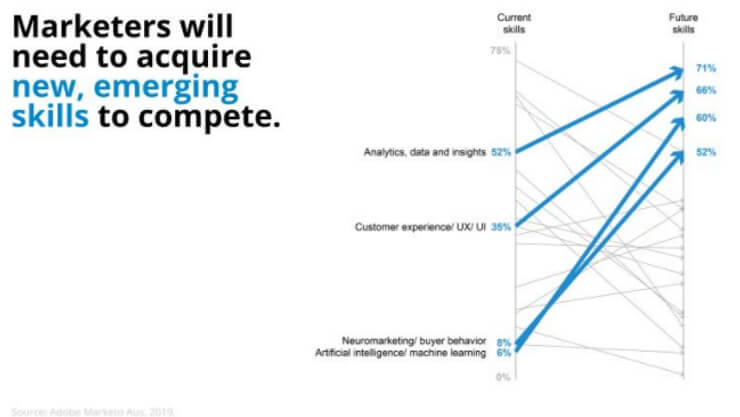
This chart (a slope graph) highlights the data with a strong headline. It’s a simple assertion, color-coded to bracket a set of new, emerging skills for marketing.
Connect your headline to a key piece of information in your chart.
Color draws the eye. We want to use color to catch your attention, categorize, as well as point to insights.
A couple of tips here:
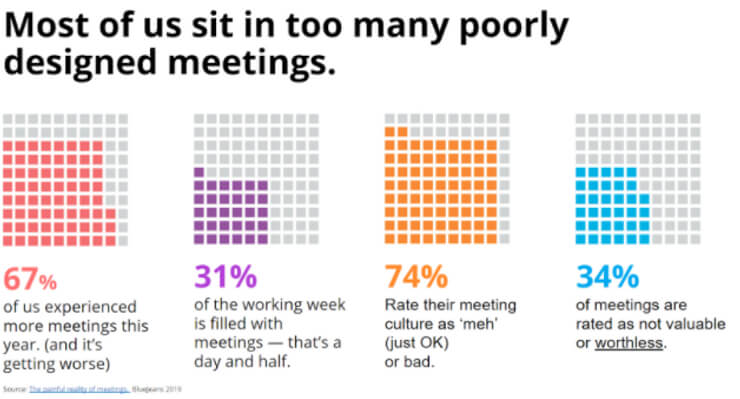
The color keying on this chart (a series of icon arrays) works — each color is used in a particular icon array.

The color keying on this chart is stronger. By reducing to a single color, it makes the point stand out more.
There’s a lot of unnecessary stuff on your chart. Redundant information. Unnecessary stuff. Information overload — you get the point. In charts, these are labels, axes, and gridlines that you don’t need. Color that takes away from the main point. Your job is to remove or minimize the junk and increase the readability and simplicity of your data.

Here’s a chart (bar chart) full of chartjunk. It’s made with Excel defaults.
Let’s assume that this is a suitable format for this type of data (it is). You know this insight you want to display. In this case, the gap in two activity types that are closely related — one suited to remote work, and the other not. The headline should point out that gap.
The job now is to remove unnecessary information. Including:

The same data, with chartjunk removed.
The order in which you present your data is important. Remember that humans in the western world tend to read left-to-right and top-to-bottom. That’s reflected in the visual hierarchy in your chart. The icon arrays and bar charts used in the above example have ordered data. You will note that it’s not the same order. In the case of the icon array, it’s a logical order that steps you through a logical argument to lead to a conclusion. The percentage agreement with each statement varies, but the statements are in a logical order. On the other hand, the bar chart is ordered by the “Maximum potential” data series, from largest to smallest.
It’s not just paying attention to the order of the data series. You want to make comparisons between data, calling out targets. You can make comparisons with simple target lines or variation bands.

Bullet chart, with data ordered by channel, and comparisons called out for context.
Your main point should be in the chart’s head or subhead, but you may have other insights. Use callouts to categorize and provide context.

A line chart, with callouts explaining variations and benchmarks in the data.
Last, source your data. Citations make your work look professional and allows others to understand the deeper context behind your data.
If you would like to find out how to build this capability for you and your team, please visit our page on the Presenting Data program, which is part of fassforward’s Business Storytelling series.

Gavin McMahon is a founder and Chief Content Officer for fassforward consulting group. He leads Learning Design and Product development across fassforward’s range of services. This crosses diverse topics, including Leadership, Culture, Decision-making, Information design, Storytelling, and Customer Experience. He is also a contributor to Forbes Business Council.

Eugene Yoon is a graphic designer and illustrator at fassforward. She is a crafter of Visual Logic. Eugene is multifaceted and works on various types of projects, including but not limited to product design, UX and web design, data visualization, print design, advertising, and presentation design.
¹ This contradiction, that what humans find simple is difficult for computers, is Moravec’s Paradox.
² Definition: (accounting) To make sure that every item in a ledger or in an inventory is accounted for and properly connected to other items to which they are related.
³ Wagemans, Johan, et al. "A century of Gestalt psychology in visual perception: II. Conceptual and theoretical foundations." Psychological bulletin 138.6 (2012): 1218.
⁴ Suspenders if you’re American.


